Tracking Pitch Performance in the Modern Game
How data and analytics are transforming baseball—and how you can learn from it.
Introduction: From Guessing to Measuring
How do teams know what makes a perfect pitch?
In the past, coaches relied on observation. Today, advanced systems like Statcast track every pitch with extreme precision—measuring velocity, spin rate, movement, and release point. (MLB.com)
This transformation from intuition → data → prediction reflects the same thinking skills required for the SAT.
Section 1: Evolution of Pitch Tracking Technology
Table 1. Pitch Tracking: 1.0 → 2.0 → 3.0
| Version | Technology | Capability | Limitation |
|---|---|---|---|
| 1.0 (Pre-2008) | Human observation | Basic speed estimate | Low accuracy |
| 2.0 (2008–2015) | PITCHf/x radar | Velocity + pitch type | Limited detail |
| 3.0 (2015–Now) | Statcast + Hawk-Eye | Spin rate, release point, movement | Complex data |
Since 2008, baseball entered the “pitch-tracking era,” where every pitch can be recorded and analyzed. (MLB.com)
Modern systems now capture hundreds of thousands of pitches per season, enabling deep performance insights. (MLB.com)
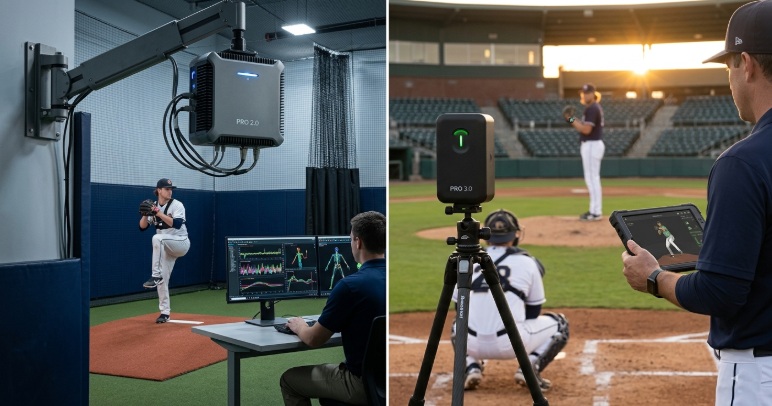
Figure 1. PRO 2.0 TO 3.0
Section 2: What Data Reveals
Breaking Down a Pitch
Modern systems measure:
- Velocity (speed)
- Spin rate (rotation)
- Pitch movement (curve, drop)
- Release point (where ball leaves hand)
Table 2. Data → Insight → Performance
| Data Type | What It Means | Why It Matters |
|---|---|---|
| Velocity | Speed of pitch | Harder to hit |
| Spin Rate | Ball rotation | Affects movement |
| Release Point | Pitch origin | Deception |
| Movement | Ball path | Confuses hitters |
This data allows teams to analyze performance scientifically instead of relying only on experience. It transforms baseball into a data-driven decision system, similar to solving SAT problems using evidence.
Figure 2. Pitch Movement & Arsenal Clustering
Section 3: From Data to Strategy (The 3.0 Era)
Analytics Drives Decisions
Teams now use data to:
- Predict hitter behavior
- Optimize pitch selection
- Prevent injuries
- Improve training efficiency
Modern analytics teams use massive datasets to gain competitive advantage.
Table 3. Traditional vs Data-Driven Baseball
| Approach | Traditional | Modern (3.0) |
|---|---|---|
| Decision | Coach intuition | Data analysis |
| Training | Repetition | Measured feedback |
| Strategy | Experience-based | Predictive modeling |
| Advantage | Limited | Scalable & precise |
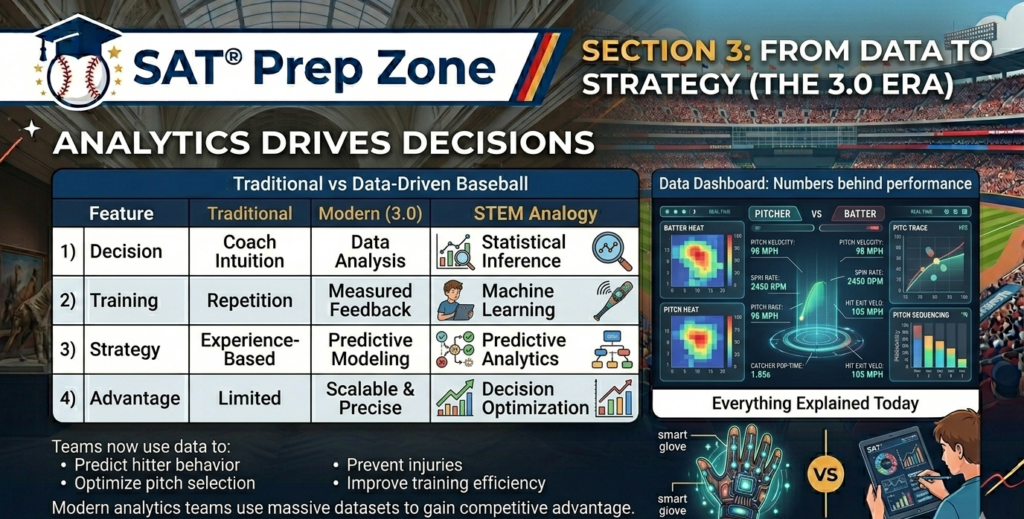
Figure 4. Strategy Decision Support Method and System
Section 4: Challenges of Technology
Limits of Data
Table 4. Technology Trade-offs
| Challenge | Explanation | Impact |
|---|---|---|
| Data overload | Too much information | Hard to interpret |
| Cost | Expensive systems | Unequal access |
| Accuracy limits | Small tracking errors | Imperfect decisions |
| Over-reliance | Ignoring human judgment | Reduced intuition |
Even advanced systems are not perfect. Understanding limitations is key—just like evaluating evidence critically on the SAT.
Section 5: SAT-Style Reading Questions
Passage
Modern baseball has shifted from observation-based decisions to data-driven analysis. Technologies such as Statcast allow teams to measure pitch characteristics with precision, leading to improved performance and strategy. However, these systems also introduce challenges, including complexity and over-reliance on data.
Q1. Main Idea
A. Technology has no impact on baseball
B. Data analytics has transformed baseball strategy
C. Players no longer need training
D. Coaches are no longer important
Q2. Evidence-Based Question
Which detail best supports the answer to Q1?
A. Players throw pitches
B. Statcast measures pitch characteristics
C. Baseball is popular
D. Teams play games
Q3. Vocabulary in Context
“Precision” most nearly means:
A. Speed
B. Accuracy
C. Strength
D. Distance
Section 6: SAT-Style Math Questions
Q4. Percentage Increase
A pitcher improves strike accuracy from 55% to 66%.
What is the percentage increase?
Q5. Ratio Problem
A system tracks 300 fastballs and 200 curveballs.
What is the ratio of fastballs to total pitches?
Q6. Data Interpretation
Out of 50 pitches, 40 are strikes.
What is the strike rate?
Section 7: Interactive Museum Challenge
Mission: Be the Data Analyst – Museum Investigation
Visit the Baseball Innovation Museum
Go to: https://museum.baseballinnovation.org
Task
- Navigate to a section related to:
- Pitch tracking
- Performance technology
- Data analytics in baseball
- Find at least TWO performance metrics used to evaluate a pitcher
(examples: velocity, spin rate, movement, release point)
Question
Based on what you discovered from the museum, which is the BEST decision for improving pitching performance?
A. Ignore data and rely only on feeling
B. Use multiple data metrics (e.g., velocity + spin rate + movement) together
C. Focus only on speed
D. Randomly choose pitches
Explain Your Evidence (NEW – SAT STYLE)
Write 1–2 sentences:
What specific information from the museum helped you choose your answer?
Section 8: Riddle
I see what eyes cannot,
Measure what hands cannot feel.
I turn motion into numbers,
Revealing what is real.
What am I?
SAT Skill Connection
This exhibit trains you to:
- Identify main ideas
- Use evidence to support claims
- Interpret data and percentages
- Evaluate strengths and limitations
These are key skills tested on the SAT.
Section 9: Apply the Lesson
How does data improve decision-making in real life?
Write 2–3 sentences connecting sports analytics to school or daily life.
✅ Answer Key
- Q1: B
- Q2: B
- Q3: B
- Q4: 20%
- Q5: 300/500 = 3/5
- Q6: 80%
- Challenge: B
- Riddle: Data tracking technology / Statcast
References
Major League Baseball. (n.d.). Statcast glossary. Retrieved from MLB.com (MLB.com)
Baccellieri, E. (2023). How MLB pitch tracking works. Sports Illustrated. (SI)
Lucks, R. (2025). Statcast pitch tracking overview. RotoBaller. (RotoBaller)